Monitoring the microbiome for food safety and quality using deep shotgun sequencing
Evaluation of microbial identification capability in total RNA and DNA sequencing
Microbial identification in microbiomes often leverages shotgun DNA sequencing; however, total RNA sequencing can provide additional information about viable bacterial activity in a community via transcriptional activity. Since using total RNA to study food microbiomes is novel, each step of the analysis workflow (Fig. 1) was carefully designed and scrutinized for accuracy. For all analyses done in this study, we report relative abundance in reads per million (RPM) (Eq. 1) as recommended by Gloor et al.31,32 and apply the conservative threshold of RPM > 0.1 to indicate presence as indicated by Langelier et al. and Illot et al.33,34. Numerically, this threshold translates to ~30 reads per genus per sample considering a sequencing depth of ~300 million reads per sample (see the section “Microbial identification“). First, we examined the effectiveness of RNA for taxonomic identification and relative quantification of microbes in the presence of food matrix reads. We observed that RNA sequencing results correlated (R2 = 0.93) with the genus relative quantification provided by DNA sequencing (Supplementary Fig. S1). RNA sequencing also detected more genera demonstrated by a higher α-diversity than the use of DNA (Supplementary Fig. S2). In addition, from the same starting material, total RNA sequencing resulted in 2.4-fold more reads classified to microbial genera compared to total DNA sequencing (after normalizing for sequencing depth). This increase is substantial as microbial reads are such a small fraction of the total sequenced reads. Considering these results, we further examined the microbial content from total RNA extracted from 31 HPP samples (Supplementary Table 1) that resulted in an average of ~300 million paired-end 150 bp sequencing reads per sample in this study.
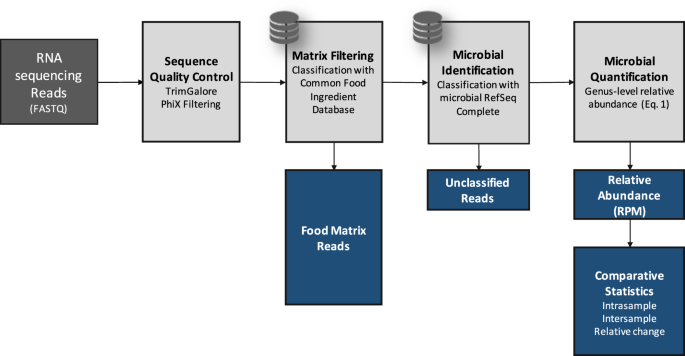
Description of the bioinformatic steps (light gray) applied to high protein powder metatranscriptome samples (dark gray). Black arrows indicate data flow and blue boxes describe outputs from the pipeline.
Evaluation and application of in silico filtering of eukaryotic food matrix reads
Sequenced reads from the eukaryotic host or food matrix may lead to false positives for microbial identification in microbiome studies35. This may occur partly due to reads originating from low complexity regions of eukaryotic genomes, e.g., telomeric and centromeric repeats, being misclassified as spurious microbial hits36. In total DNA or RNA sequencing of clinical or animal or even plant microbiomes, eukaryotic content may often comprise >90% of the total sequencing reads. This presents an important bioinformatic challenge that we addressed by filtering matrix content using a custom-built reference database of 31 common food ingredient and contaminant genomes (Supplementary Table 2) using the k-mer classification tool Kraken37. This step allows for rapidly classifying all sequenced reads (~300 million reads for each of 31 samples) as matrix or non-matrix. The matrix filtering process yielded an estimate of the total percent matrix content for a sample. See our work in Haiminen et al.16 on quantifying the eukaryotic food matrix components with further precision.
To validate the matrix filtering step, we constructed in silico mock food microbiomes with a high proportion of complex food matrix content and low microbial content (Supplementary Table 3). We then computed the true positive, false positive, and false-negative rates of observed microbial genera and sequenced reads (Table 1). False-positive viral, archaeal, and eukaryotic microbial genera (as well as bacteria) were observed without matrix filtering, although bacteria were the only microbes included in the simulated mixtures. Introducing a matrix filtering step to the pipeline improved read classification specificity to >99.96% (from 78 to 93% without filtering) in both simulated food mixtures while maintaining zero false negatives. With this level of demonstrated accuracy, we used bioinformatic matrix filtering prior to further microbiome analysis.
HPP microbiome ecology
After filtering eukaryotic matrix sequences, we applied the remaining steps in the bioinformatic workflow (Fig. 1) to examine the shift in the HPP microbiome membership and to quantify the relative abundance of microbes at the genus level. Genus is the first informative taxonomic rank for food pathogen identification that can be considered accurate given the current incompleteness of reference databases11,38,39,40,41 and was therefore used in subsequent analyses. Overall, between 98 and 195 microbial genera (avg. 119) were identified (RPM > 0.1) per HPP sample (Supplementary Table 4). When analyzing α-diversity i.e., the number of microbes detected per sample, inter-sample comparisons may become skewed unless a common number of reads is considered since deeper sequenced samples may contain more observed genera merely due to a greater sampling depth42,43. Thus, we utilized bioinformatic rarefaction i.e., subsampling analysis to showcase how microbial diversity was altered by sequencing depth. Examination of α-diversity across a range of in silico subsampled sequencing depths showed that the community diversity varied across samples (Fig. 2a). One sample (MFMB-04) had 1.7 times more genera (195) than the average across other samples (avg. 116, range 98–143) and exhibited higher α-diversity than any other sample at each in silico sampled sequencing depth (Fig. 2a). Rarefaction analysis further demonstrated that when considering fewer than ~67 million sequenced reads, the observable microbial population was not saturated (median elbow calculated as indicated in Satopää, et al.44). This observation suggests that deeper sequencing or more selective sequencing of the HPP microbiomes will reveal more microbial diversity.
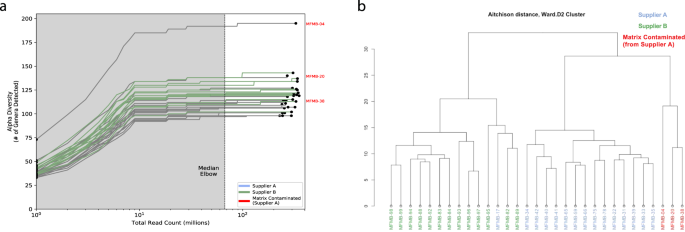
a Alpha diversity (number of genera) for all (n = 31) high protein powder metatranscriptomes is compared to the total number of sequenced reads for a range of in silico subsampled sequencing depths. The dashed vertical line indicates the medial elbow (at ~ 67 million reads). b Hierarchical clustering of Aitchison distance values of poultry meal samples based on microbial composition. Samples were received from Supplier A (blue and red) and Supplier B (green). Matrix-contaminated samples are additionally marked in red.
Notably, between 2 and 4% (~5,000,000–14,000,000) of reads per sample remained unclassified as either eukaryotic matrix or microbe (Supplementary Fig. S3). However, the unclassified reads exhibited a GC (guanine plus cytosine) distribution similar to reads classified as microbial (Supplementary Fig. S4), indicating these reads may represent microbial content that is absent or sufficiently divergent from existing references.
We calculated β-diversity to study inter-sample microbiome differences and to identify any potential outliers among the sample collection. The Aitchison distances45 of microbial relative abundances were calculated between samples (as recommended for compositional microbiome data31,32), and the samples were hierarchically clustered based on the resulting distances (Fig. 2b). The two primary clades were mostly defined by the supplier (except for MFMB-17). Samples were collected over several months with Supplier A contributing three batches over time and Supplier B contributing one shipment batch (Supplementary Table 1); despite time point differences, the microbiome composition still clusters into separate clades by the supplier. In Haiminen et al.16, we reported that three of the HPP samples contained unexpected eukaryotic species. We hypothesized that the presence of these contaminating matrix components (beef identifiable as Bos taurus and pork identifiable as Sus scrofa) would alter the microbiome as compared to chicken (identifiable as Gallus gallus) alone. Clustering HPP samples using their microbiome membership led to a distinctly different group of the matrix-contaminated samples, supporting this hypothesis (Fig. 2b). These observations indicate that samples can be discriminated based on their microbiome content for originating source and supplier, which is necessary for source tracking potential hazards in food.
Comparative analysis of HPP microbiome membership and composition
We identified 65 genera present in all HPP samples (Fig. 3a), whose combined abundance accounted for between 88 and 99% of the total abundances of detected genera per sample. Bacteroides, Clostridium, Lactococcus, Aeromonas, and Citrobacter were the five most abundant of these microbial genera. The identified microbial genera also included viruses, the most abundant of which was Gyrovirus (<10 RPM per sample). Gyrovirus represents a genus of non-enveloped DNA viruses responsible for chicken anemia which is ubiquitous in poultry. While there were only 65 microbial genera identified in all 31 HPP samples, the α-diversity per sample was on average twofold greater as previously indicated.
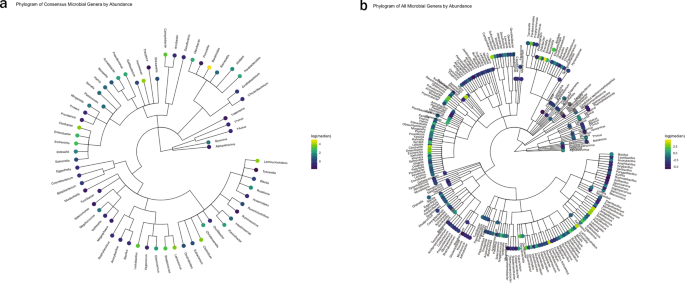
a Phylogram of the 65 microbial genera present in all samples with RPM > 0.1. b Phylogram of microbes observed in any sample. Log of the median RPM value across samples is indicated. Gray indicating a median RPM value of 0.
Beyond the collection of 65 microbes observed in all samples, there were an additional 164 microbes present in various HPP samples. Together, we identified a total of 229 genera among the 31 HPP samples tested (Figs 3b and 4, Supplementary Table 4). In order to identify genera that were most variable between samples, we computed the median absolute deviation (MAD)46 using the normalized relative abundance of each microbe (Fig. 5a). The abundance of Bacteroides was the most variable among samples (median = 148.1 RPM, MAD = 30.6) and showed increased abundance in samples from Supplier A (excluding samples with known host contamination) compared to Supplier B (Benjamini–Hochberg adjusted P < 0.00005). In total, there were 55 genera with significant differences in abundance between Supplier A and Supplier B (adjusted P < 0.01). Of the ten most variable genera based on MAD, Aeromonas, Enterobacter, Pseudomonas, and Lactobacillus also had significant differences between Supplier A and B (adjusted P < 0.01 with their relative abundances shown in Fig. 5b). In addition, Clostridium (median = 37.4 RPM, MAD = 24.2), Lactococcus (median = 36.8 RPM, MAD = 18.2), and Lactobacillus (median = 24.2, MAD = 7.2) were also highly variable and threefold to fourfold more abundant in samples MFMB-04 and MFMB-20 compared to other samples (Fig. 5b). Pseudomonas (median = 11.1 RPM, MAD = 12.2) was markedly more abundant in MFMB-83 than any other sample (Fig. 5b). These genera highlight variability between microbiomes based on supplier origin or food source and may provide insights into other dissimilarities in these samples.
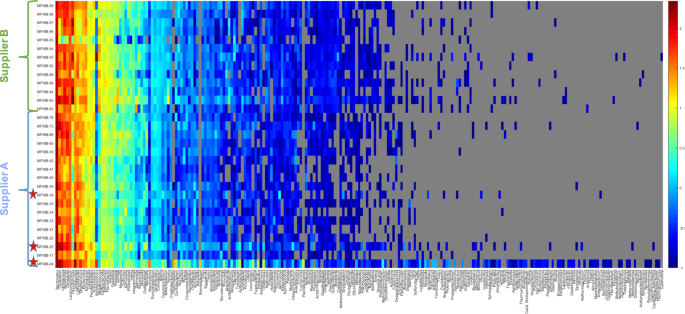
Heatmap (log10-scale) of HPP microbial composition and relative abundance (R
PM) where absence (RPM < 0.1) is indicated in gray. Genera are ordered by summed abundance across samples. Samples were received from Supplier A (blue) and Supplier B (green). Red stars indicate matrix-contaminated samples (from Supplier A).
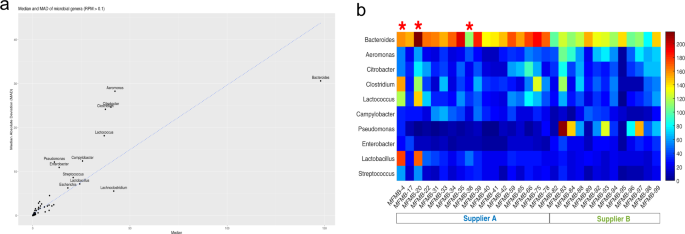
a All identified microbial general are plotted with median value and median absolute deviation (MAD) of RPM abundance. Genera with MAD > 5 are labeled with the genus name and a linear fit is indicated by a blue dotted line. b Heatmap (log10-scale) of ten microbial genera with the largest median absolute deviation (MAD) across samples. Genera are ordered by decreasing MAD from top to bottom. Samples were received from Supplier A (blue) and Supplier B (green). Red stars indicate matrix-contaminated samples (from Supplier A).
Microbiome shifts in response to changes in food matrix composition
We tested the hypothesis that the microbiome composition will shift in response to changes in the food matrix and can be a unique signal to indicate contamination or adulteration. In 28 of the 31 HPP samples, >99% of the matrix reads were determined in our related work16 to originate from poultry (Gallus gallus), which was the only ingredient expected based on ingredient specifications. However, three samples had higher pork and beef content compared to all other HPP samples: MFMB-04 (7.74% pork, 8.99% beef), MFMB-20 (0.53% pork, 1.00% beef), and MFMB-38 (0.92% pork, 0.29% beef) compared to the highest pork (0.01%) and beef (0.00%) content among the other 28 HPP samples (Supplementary Data by Haiminen et al.16). The microbiomes of these matrix-contaminated samples, each coming from Supplier A, also clustered into a separate sub-cluster (Fig. 2b). This demonstrated that a shift in the food matrix composition was associated with an observable shift in the food microbiome.
We further computed pairwise Spearman’s correlation between all samples, using the RPM vectors for the 229 detected genera as input (Supplementary Fig. S5). Here, we exclude MFMB-04, MFMB-20, and MFMB-38 from the group “Supplier A samples” and consider them as a separate matrix-contaminated group. The mean correlation between Supplier A samples was 0.946, while the mean correlation between Supplier B samples was 0.816. The mean correlation between Supplier A and Supplier B samples was 0.805, lower than either within-group correlation. Contrasted with this, the mean correlation between MFMB-04 and Supplier A samples was 0.656, analogously for MFMB-20 the mean correlation was 0.866, and for MFMB-38 it was 0.885. The increasing correlation values correspond with decreasing percentages of cattle and pork reads in the matrix-contaminated samples (16.7% in MFMB-04, 1.5% in MFMB-20, and 1.2% in MFMB-38), indicating a trend toward the microbial baseline with decreasing matrix contamination.
MFMB-04 and MFMB-20 had the highest percentage of microbial reads compared to other samples (Supplementary Fig. S3). They also exhibited an increase in Lactococcus, Lactobacillus, and Streptococcus relative abundances compared to other samples (Fig. 5b), also reflected at respective higher taxonomic levels above genus (Supplementary Fig. S6).
There were 53 genera identified uniquely in MFMB-04 and/or MFMB-20 i.e., RPM values above the aforementioned threshold in these samples but not present in any other sample. (MFMB-38 had a very low microbial load and contributed no uniquely identified genera above the abundance threshold.) MFMB-04 contained 44 unique genera (Fig. 4) with the most abundant being Macrococcus (35.8 RPM), Psychrobacter (23.8 RPM), and Brevibacterium (18.1 RPM). In addition, Paenalcaligenes was present only in MFMB-04 and MFMB-20 with an RPM of 6.4 and 0.3, respectively, compared to a median RPM of 0.004 among other samples. Notable differences in the matrix-contaminated samples’ unique microbial community membership compared to other samples may provide microbial indicators associated with unanticipated pork or beef presence.
Genus-level identification of foodborne microbes
We evaluated the ability of total RNA sequencing to identify genera of commonly known foodborne pathogens within the microbiome. We focused on fourteen pathogen-containing genera including Aeromonas, Bacillus, Campylobacter, Clostridium, Corynebacterium, Cronobacter, Escherichia, Helicobacter, Listeria, Salmonella, Shigella, Staphylococcus, Vibrio, and Yersinia that were found to be present in the HPP samples with varying relative abundances. Of these genera, Aeromonas, Bacillus, Campylobacter, Clostridium, Corynebacterium, Escherichia, Salmonella, and Staphylococcus were detected in every HPP with median abundance values between 0.58–48.31 RPM (Fig. 6a). This indicated that a baseline fraction of reads can be attributed to foodborne microbes when using NGS. Of those genera appearing in all samples, there was observed sample-to-sample variation in their abundance with some genera exhibiting longer tails of high abundance, e.g., Staphylococcus and Salmonella, whereas others exhibit very low abundance barely above the threshold of detection, e.g., Bacillus and Yersinia (Fig. 6a). None of the pathogen-containing genera were consistent with higher relative abundances due to differences in food matrix composition. Bacillus and Corynebacterium exhibited slightly higher relative abundances in sample MFMB-04 which contained 7.7% pork and 9.0% beef (Fig. 6b). Yet while MFMB-04 contained higher cumulative levels of these foodborne microbes, the next highest sample was MFMB-93 which was not associated with altered matrix composition, and both MFMB-04 and MFMB-93 contained higher levels of Staphylococcus (Fig. 6b). Thus, matrix composition alone did not explain variations of these pathogen-containing genera.
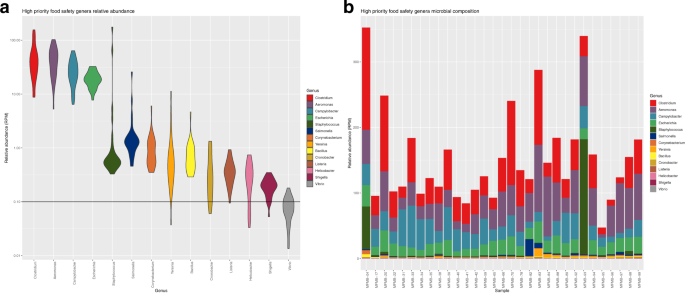
a Relative abundance distribution of genera with high relevance to food safety and quality from high protein powder (HPP) total RNA sequenced microbiomes. The width of the violin plot indicates the density of samples with relative abundance at that value. Observation threshold of RPM = 0.1 is indicated with the horizontal black line. b The relative abundances of those same genera are shown across samples of HPP total RNA sequenced samples.
Interestingly, low to moderate levels of Salmonella were detected within all 31 HPP microbiomes (Fig. 6a). The presence of Salmonella in HPP is expected but the viability of Salmonella is an important indicator of safety and quality. Thus, we further sought to delineate Salmonella growth capability within these microbiomes by comparing culturability with multiple established bioinformatic NGS methods for Salmonella relative abundances in the samples.
Assessment of Salmonella culturability and total RNA sequencing
Total RNA sequencing of food microbiomes has the potential to provide additional sensitivity beyond standard culture-based food safety testing to confirm or reject the presence of potentially pathogenic microbes. In all of the examined HPP samples, some portion of the sequenced reads were classified as belonging to pathogen-containing genera (Fig. 6); however, the presence of RNA transcripts does not necessarily indicate the current growth of the organism itself. We further inspected one pathogen of interest, Salmonella, to determine the congruence between sequencing-based and culturability results. Of the 31 samples examined with total RNA sequencing, Salmonella culture testing was applied to 27 samples, of which four were culture-positive. Surprisingly, Salmonella culture-positive samples were not among those with the highest relative abundance of Salmonella from sequencing (Fig. 7a). When ranking the samples by decreasing Salmonella abundance, the culture-positive samples were not enriched for higher ranks (P = 0.86 from Wilcoxon rank-sum test indicating that the distributions are not significantly different, Table 2). To confirm that the microbiome analysis pipeline did not miss Salmonella reads present, we completed two orthogonal analyses on the same dataset used in the microbial identification step. The reference genomes relevant to these additional analyses were publicly available and closed high-quality genomes available from the sources indicated below.
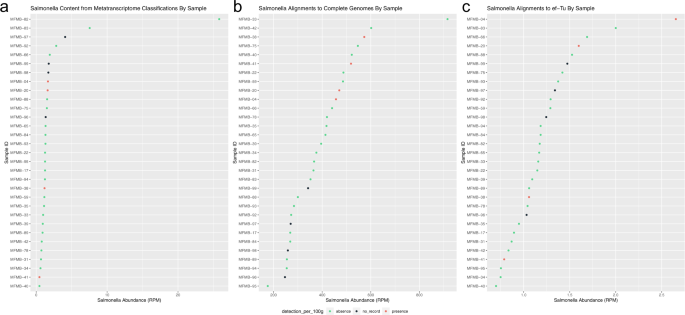
Read abundance (RPM) shown from a k-mer classification to NCBI Microbial RefSeq Complete, b alignments to 1447 Salmonella genomes, and c alignments to 4846 EF-Tu gene sequences. Salmonella presence (red) indicates culture-positive result, absence (green) indicates culture-negative result, and no record (black) indicates samples for which no culture test was completed.
First, for targeted analysis, we aligned the sequenced reads using a different tool, Bowtie247, to an augmented Salmonella-only reference database. This reference was comprised of the 264 Salmonella genomes extracted from NCBI RefSeq Complete (used in our previous microbial identification step) as well as an additional 1183 public Salmonella genomes which represent global diversity within the genus48. The number of reads that aligned to the Salmonella-only reference was on average 370-fold higher than identified as Salmonella by Kraken using the multi-microbe NCBI RefSeq Complete. In this additional analysis, the culture-positive samples had overall higher ranks compared to culture-negative samples (P = 0.06, Table 2), indicating that additional Salmonella genomic data in the reference significantly improved discriminatory identification power. Salmonella culture-positive samples were still not the most abundant (Fig. 7b), but with an enriched database, sequencing positioned all four culturable samples within the top ten rankings.
The second additional analysis examined the alignment of the reads to a specific gene required49 for replication and protein production in actively dividing Salmonella—elongation factor Tu (ef-Tu). This was done by aligning the reads to 4846 gene sequences for ef-Tu extracted for a larger corpus of Salmonella genomes from the Functional Genomics Platform (formerly OMXWare)50. The relative abundances of this transcript in culture-positive samples were still comparable to culture-negative samples (Fig. 7c). Culture-positive samples did not exhibit higher ranks compared to culture-negative samples (P = 0.56, Table 2), indicating that ef-Tu relative abundance alone was not sufficient to improve the lack of concordance in culturability vs sequencing. These two orthogonal analyses demonstrated that results from carefully developed culture-based testing and those from current high-throughput sequencing technologies, whether assessed at overall reads aligned or specific gene abundances, were not conclusively in agreement when detecting active Salmonella in food samples (Fig. 7 and Table 2). However, the use of a reference database enriched in whole-genome sequences of the specific organism of interest was found appropriate for food safety applications.
Since microbes compete for available resources within an environmental niche and therefore impact one another51, we investigated Salmonella culture results in conjunction with co-occurrence patterns of other microbes in the total RNA sequencing data (Fig. 8). Point-biserial correlation coefficients (rpb) were calculated between Salmonella culturability results (presence or absence which were available for 27 of the 31 samples) and microbiome relative abundance. We observed 31 genera that positively correlated and with Salmonella presence (rpb > 0.5). Erysipelothrix, Lactobacillus, Anaerococcus, Brachyspira, and Jeotgalibaca exhibited the largest positive correlations. Gyrovirus was negatively correlated with Salmonella growth (rpb = −0.54). In three of the four Salmonella-positive samples (MFMB-04, MFMB-20, and MFMB-38), food matrix contamination was also observed (Supplementary Data in Haiminen et al.16). The concurrency of Salmonella growth and matrix contamination was affirmed by the microbial co-oc
currence (specifically Erysipelothrix, Brachyspira, and Gyrovirus). This highlights the complex dynamic and community co-dependency of food microbiomes, yet shows that multiple dimensions of the data (microbiome composition, culture-based methods, and microbial load) will signal anomalies from typical samples when there is an issue in the supply chain.
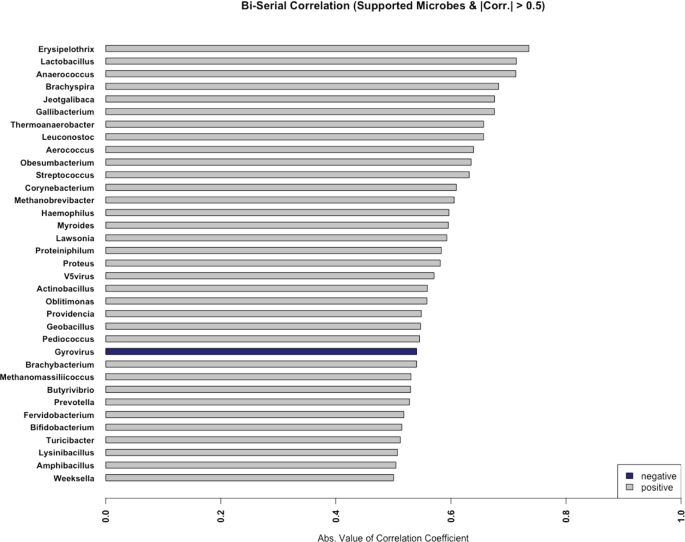
Only those genera with the absolute value of the correlation coefficient >0.5 are shown. Positive and negative correlations are indicated in gray and blue, respectively.


